Despite its potential to experience pullback, Solana's price is likely to surge in the long-term.
Share
Key Takeaways
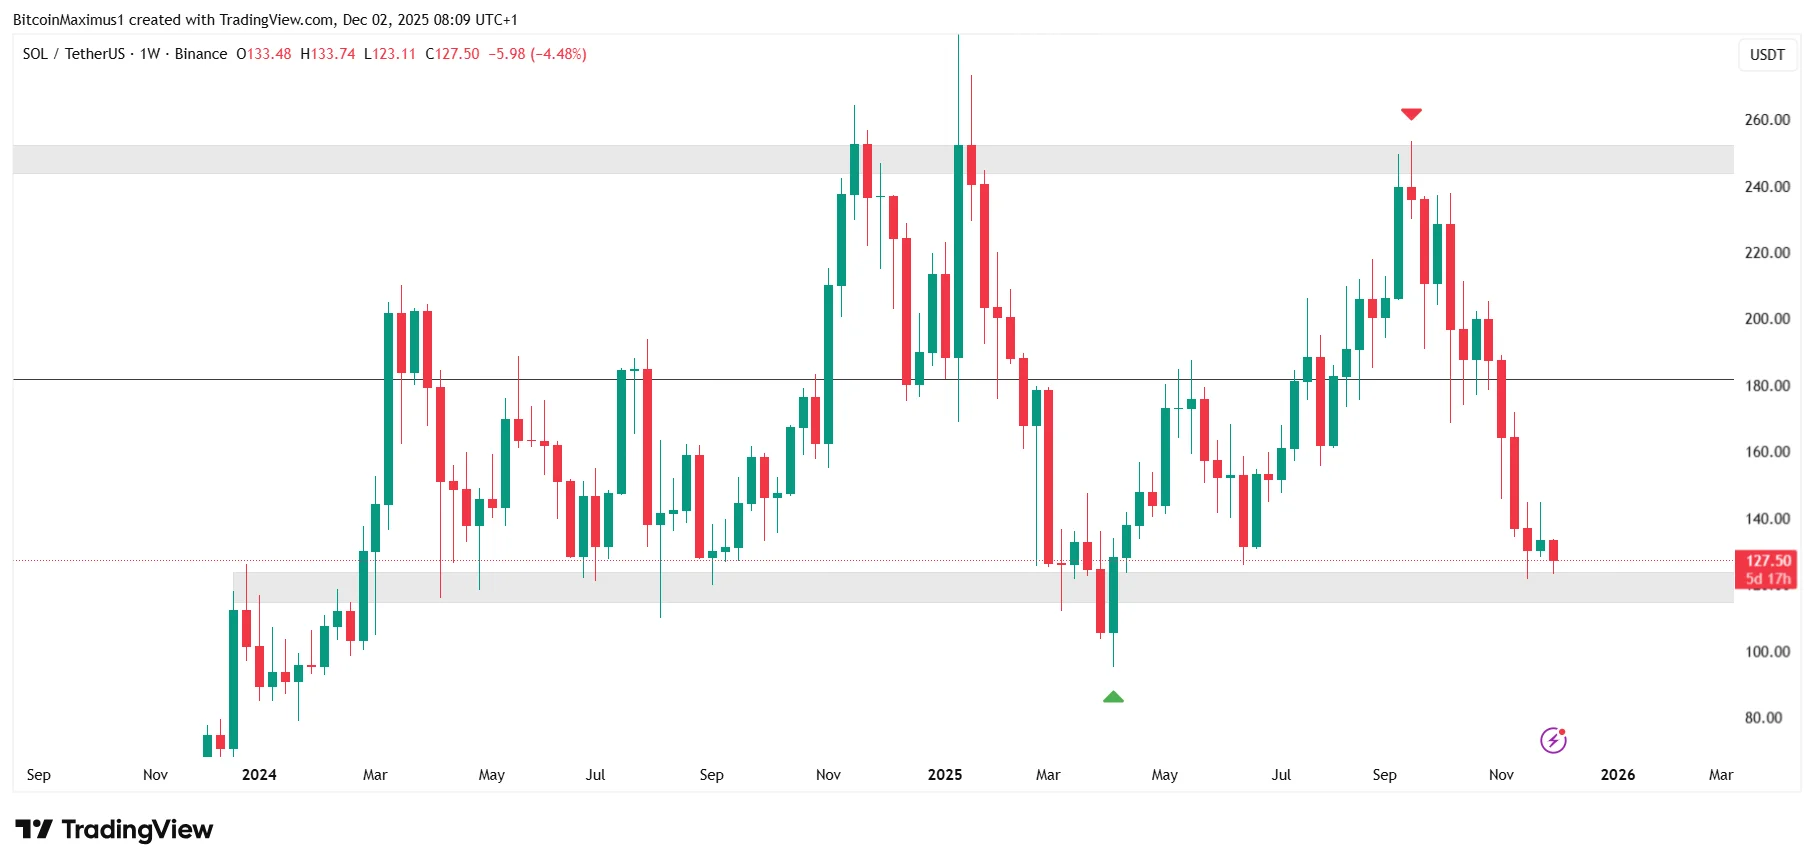
Solana (SOL) failed to close above the $165 horizontal resistance area.
SOL’s recovery since July has been weaker than that of the rest of the crypto market.
Will SOL reach another high, or will it continue underperforming in 2026?
Solana, once a standout performer since the 2022 bear market, is now struggling to maintain upward momentum.
At the start of the year, SOL hit a new all-time high just ahead of Donald Trump’s inauguration. However, since then, the token has failed to reclaim the $200 mark.
In this analysis, CCN examines the Solana price prediction for 2026. Here, you will also find the forecasts for 2027 and 2030.
Solana Price Prediction
Minimum Solana Price Prediction
Average Solana Price Prediction
Maximum Solana Price Prediction
2026
$45
$52
$145
2027
$100
$150
$200
2030
$400
$950
$1,600
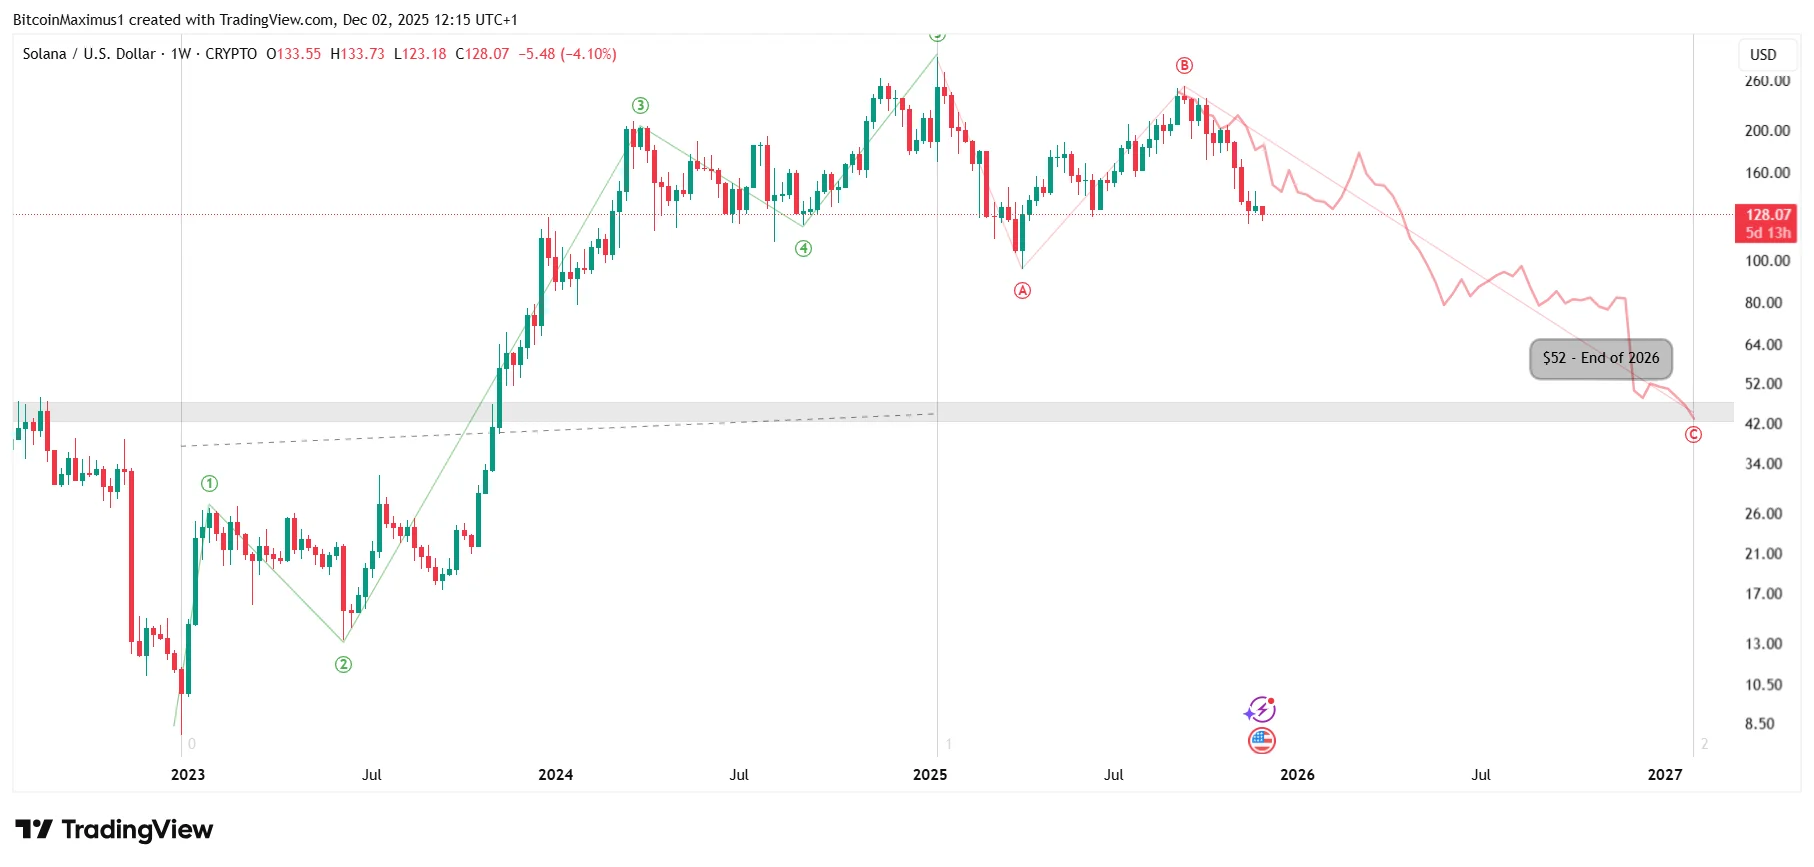
The most likely count shows that Solana completed a five-wave upward movement starting in December 2022, leading to the new all-time high in January.
Since then, the Sol price is completing an A-B-C correction (red) and is currently in wave C
If the correction lasts as long as the previous upward movement, SOL will fall to a low of $52 by January 2027.
At the time of writing, SOL was trading within the $120 horizontal support area.
Once it breaks down below it, the price could plunge by another 50% because there will be no support below it.
Traders are watching closely because once Solana loses this range, the long-term trend officially flips bearish.
Short-Term SOL Price Prediction
The SOL price prediction for the next 24 hours is bearish. The price is likely to continue falling until it finishes its correction.
Solana Market Cap to TVL Ratio
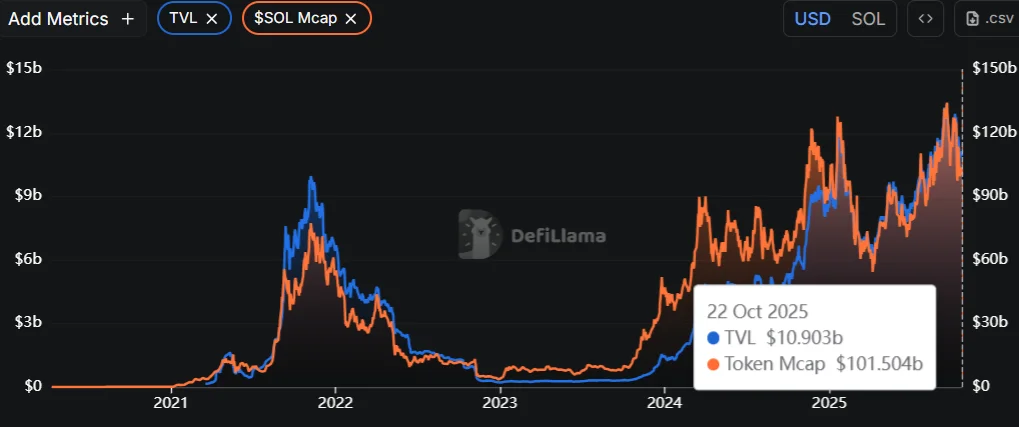
The Market Cap to Total Value Locked (TVL) ratio measures the valuation of a decentralized finance (DeFi) project by comparing its market capitalization to the total value of assets locked in its smart contracts.
This ratio shows the project’s utilization and links the platform’s health to locked asset value.
A ratio above 1.0 indicates overvaluation, because the market cap exceeds the value of assets used in the platform. A ratio below 1.0 indicates undervaluation, because the market cap is lower than the value of locked assets.
At the time of writing, the Solana TVL ratio was 9, indicating an overvaluation.
CCN Strength Index
The CCN Strength Index combines an array of advanced market signals to measure the strength of individual cryptocurrencies over the last 30 days.
Every day, it assigns a strength score, ranging from 0 to 100, to the top 500 assets by market capitalization on CoinMarketCap, focusing on both trend direction and the intensity of price movements.
0 to 24: Assets exhibit significant weakness, showing signs of sustained downtrend behavior.
25 to 35: The price tends to move within stable bounds with minimal volatility.
36 to 49: Assets begin a stable uptrend but without strong surges.
50 to 59: Consistent growth with moderate price advances, building momentum.
60+: Sharp price movements and high demand indicate stronger volatility and trend shifts.
The index dynamically adapts to rapid changes. For example, an asset experiencing a 100% increase within a short timeframe would see a sharp jump in its score to reflect the intensity of the rise.
However, should that asset stabilize at this new price level, the score will gradually taper down and align with the dampened momentum as the movement normalizes.
The same principle applies to rapid declines: a sudden drop will spike the score downward, but the score will slowly adjust back up as volatility decreases.
As of Dec. 2, 2025, Solana scored 45.3 on the CCN Index, suggesting a stable momentum, yet a weak uptrend.
Best Days and Months to Buy Solana
We examined the SOL price history and found the lowest prices on certain days, months, quarters, and weeks in the year, indicating the best times to buy Solana.
Time to Buy SOL
Best Day
Sunday
Best Week
45
Best Month
January
Best Quarter
First
SOL Performance Comparison
Solana is a blockchain for smart contracts. Let’s compare it with other projects in the same category with similar market capitalizations.
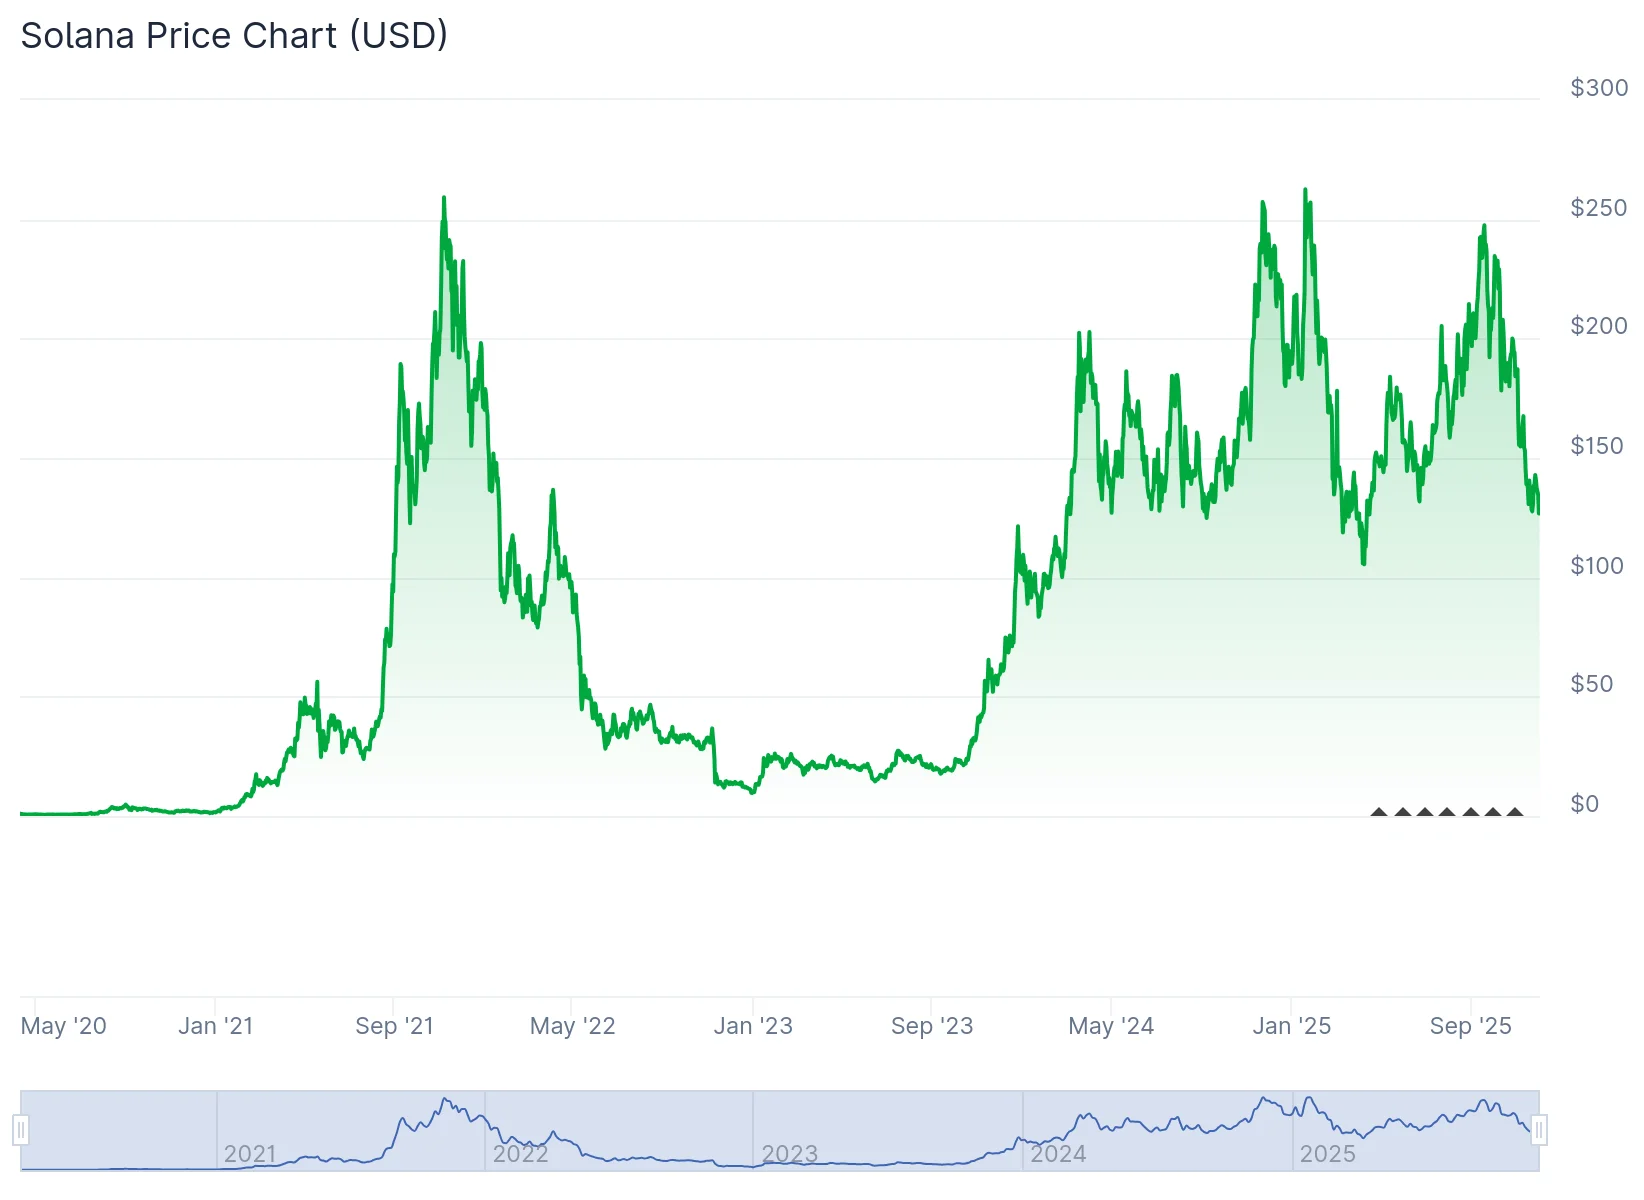
Let’s examine the Solana price history. While past performance is not an indicator of future results, it can help contextualize future price predictions.
Period
Solana Price
Last Week (Nov. 25, 2025)
$136.51
Last Month (Nov. 2, 2025)
$186.2
Three Months Ago (Sept. 2, 2025)
$210.68
Last Year (Dec. 2, 2024)
$225.3
Launch price (April 11, 2020)
$0.9511
All-time high (Jan. 19, 2025)
$293.31
All-time low (May 11, 2020)
$0.5052
Who Owns the Most Solana (SOL)?
As of Oct. 22, 2025, one wallet held a little more than 1% of the supply of Solana.
MJKqp326RZCHnAAbew9MDdui3iCKWco7fsK9sVuZTX2. The wallet holds 5,178,991 SOL or 1.01% of the supply.
52C9T2T7JRojtxumYnYZhyUmrN7kqzvCLc4Ksvjk7TxD. The wallet holds 4,371,056 SOL or 0.85% of the supply.
8BseXT9EtoEhBTKFFYkwTnjKSUZwhtmdKY2Jrj8j45Rt. The wallet holds 3,927,080 SOL or 0.77% of the supply.
GitYucwpNcg6Dx1Y15UQ9TQn8LZMX1uuqQNn8rXxEWNC. The wallet holds 3,628,341 SOL or 0.71% of the supply.
9QgXqrgdbVU8KcpfskqJpAXKzbaYQJecgMAruSWoXDkM. The wallet holds 3,141,238 SOL or 0.61% of the supply.
SOL is decentralized, with only one wallet holding more than 1% of the total supply.
Solana Supply and Distribution
Supply and distribution
Figures
Total supply
615,532,788
Circulating supply as of Dec. 2, 2025
559,283,158 (85.3% of total supply)
Holder distribution as of Dec. 2, 2025
The top 10 holders owned 6.58% of the total supply
From the Solana Whitepaper
Solana’s technical documentation, or whitepaper, says that the system is designed to be quicker and easier to use than other blockchains.
One word of warning, though. The whitepaper is full of jargon, with sentences like “When used alongside a consensus algorithm such as Proof of Work (PoW) or Proof of Stake (PoS), PoH can reduce messaging overhead in a Byzantine Fault Tolerant replicated state machine, resulting in sub-second finality times” likely to confuse the average reader.
Solana Explained
Blockchains can be slow. While this is especially true for Proof-of-Work (PoW) chains like Bitcoin, which use people solving mathematical equations to add blocks to the blockchain, it can also be true for Proof-of-Stake (PoS) chains such as Ethereum.
The Solana blockchain aims to solve this problem. It uses Proof-of-History (PoH) to grow its chain and reward its users. It promises 2,000 transactions per second.
Solana is part of the world of decentralized finance (DeFi). DeFi is based on the idea that people can access financial services without going through traditional banks. It supports various decentralized applications (DApps), such as the Audius music-sharing program and the Phantom Wallet.
The SOL coin powers the system and rewards those who help run the network. The coin can also be staked in return for voting rights and bought, sold, and traded on exchanges.
How Solana Works
Solana’s unique selling point is its Proof-of-History consensus mechanism. This mechanism creates a series of timestamps showing who held how much crypto at what particular point, enabling the data to be accurate and fair.
PoH has allowed Solana to have a range of other functions. These include
The SeaLevel transaction processor.
The Turbine data distribution system.
Gulf Stream is used to move transaction caching across the network.
The Tower Byzantine Fault Tolerance system allows it to calculate values.
Pipeline, which also helps with transaction processing.
Archives, which help with data storage.
SOL powers the system. Holders can stake it or set it aside in return for voting rights. People can also buy, sell, and trade it on exchanges.
Is Solana a Good Investment?
Solana is one of the largest cryptocurrencies by market cap. Its recent rise mirrors its strong performance in the second half of 2021, when it went from an also-ran to a major player.
Thanks to the integration of new players like PYUSD, the ecosystem keeps growing, which may be a positive catalyst for the SOL price.
Memecoins, liquid staking, and decentralized exchanges in Solana have enjoyed a resurgence, while the blockchain leads
On the other hand, SOL has fallen since peaking in November 2024, and we don’t know whether or not if or when it can reach a new all-time high.
As ever, you will need to be careful, do your own research, and never invest more than you can afford to lose.
Will Solana Go Up or Down?
The short-term SOL price prediction is bullish since the wave count implies the wave four correction has nearly ended. After more consolidation, an eventual breakout that completes wave five by the end of the year is predicted by various methods. Conversely, breaking down from the triangle will indicate the trend is still bearish.
Should I Invest in Solana?
Before you decide whether or not to invest in Solana, you will need to do your research, not only on SOL but also on similar cryptos such as Ethereum (ETH) and Cardano (ADA).
Ultimately, though, you will have to make this decision for yourself. Remember that prices can go down and up and that you should never invest more money than you can afford to lose.
As of Dec. 2, 2025, there were about 559 million SOL in circulation, out of a total supply of around 612.53 million.
Will Solana reach $1,000?
Our long-term Solana price prediction for the end of 2030 gives a range between $400 and $1,600 for the end of 2030.
What is Solana used for?
The SOL coin supports the Solana blockchain. People can also buy, sell, and trade it on exchanges.
Disclaimer
Please note that the contents of this article are not financial or investing advice. The information provided in this article is the author’s opinion only and should not be considered as offering trading or investing recommendations. We do not make any warranties about this information’s completeness, reliability, and accuracy. The cryptocurrency market suffers from high volatility and occasional arbitrary movements. Any investor, trader, or regular crypto user should research multiple viewpoints and be familiar with all local regulations before committing to an investment.
Valdrin Tahiri is a cryptocurrency analyst and reporter at CCN, specializing in technical analysis with a focus on Elliott Wave theory, on-chain metrics, and fundamental research. He brings over seven years of experience in the crypto space as both a trader and writer.
He discovered cryptocurrencies in 2017 while earning his MSc in Financial Markets at the Barcelona School of Economics, which sparked a deep interest in blockchain and market dynamics. Since then, he’s contributed to top crypto outlets like BeInCrypto and CoinGape.
Valdrin also served as Community Manager of BeInCrypto’s Telegram group for three years, helping grow it into one of the largest crypto communities worldwide. His expertise in market structure and price patterns allows him to break down complex trends into clear, actionable insights.
He’s published thousands of articles covering altcoins, Bitcoin cycles, and macro trends.